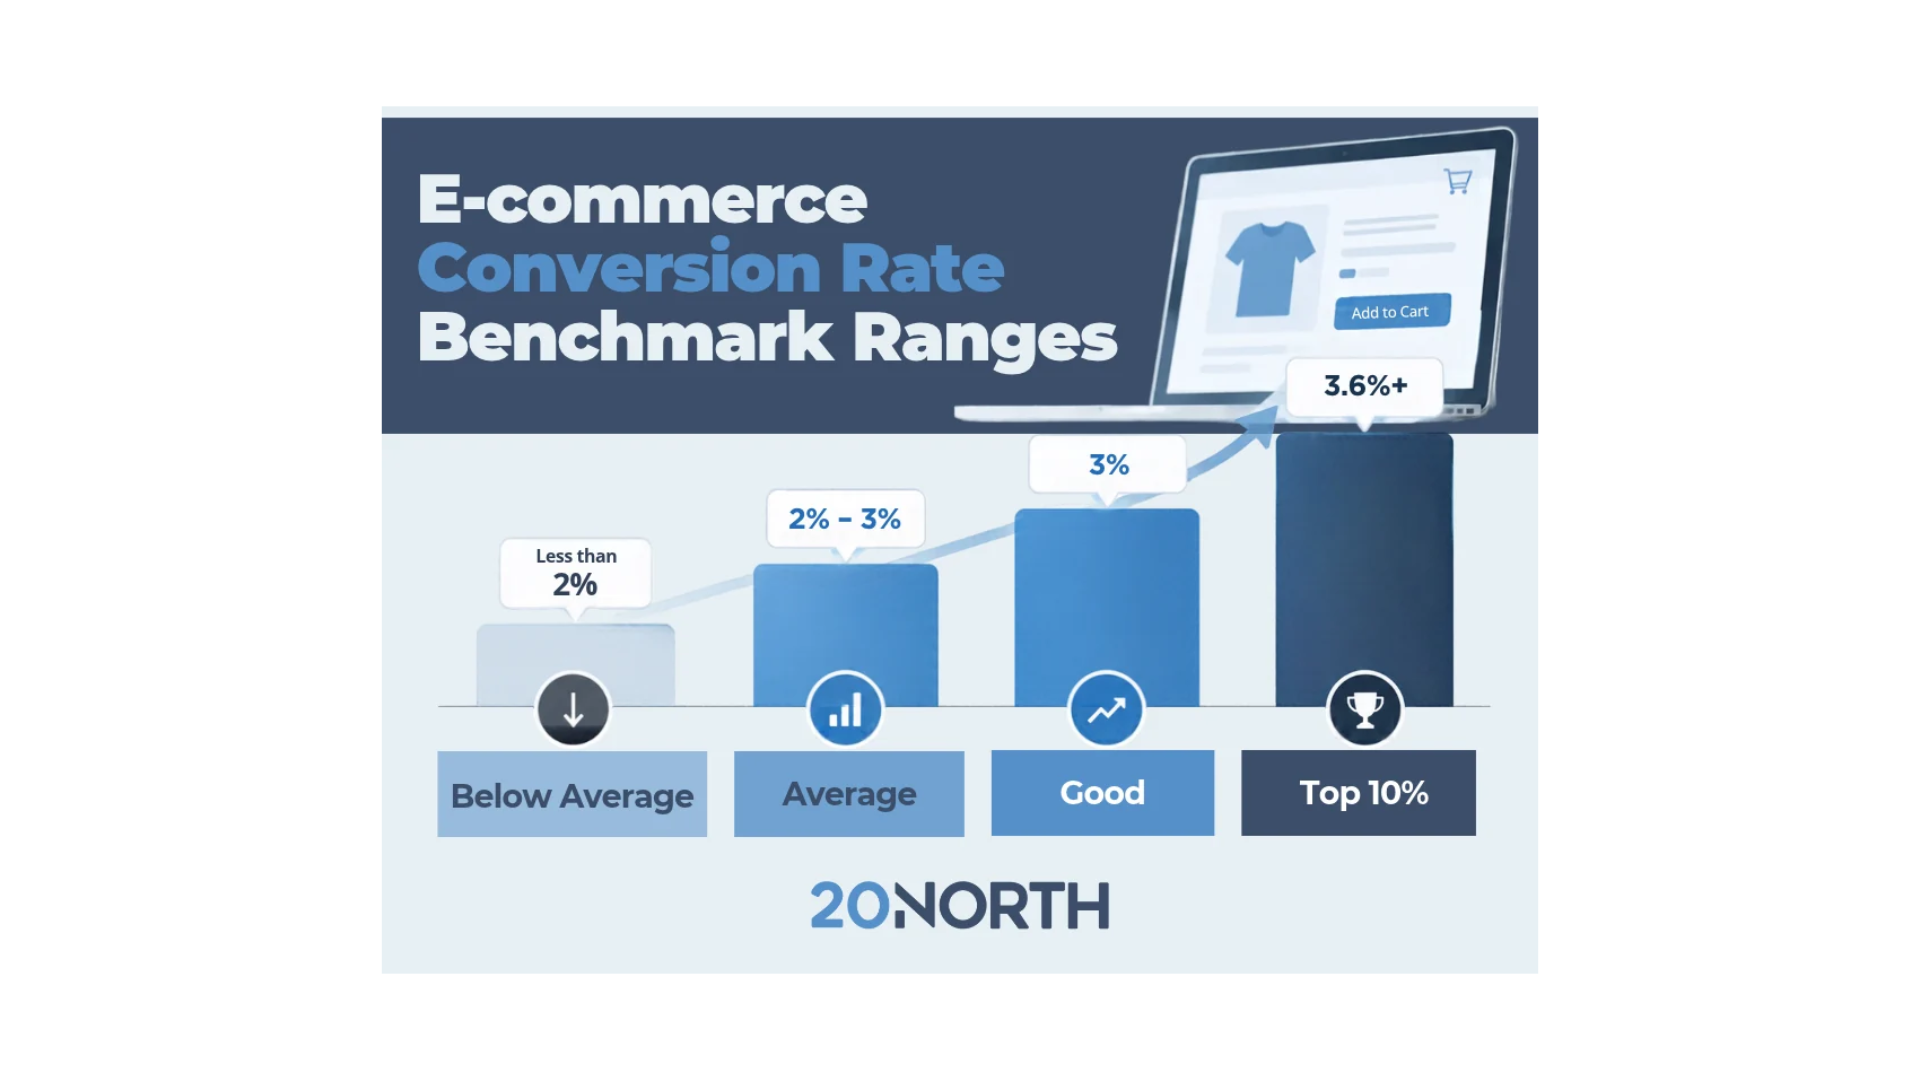
The Short Answer: A good e-commerce conversion rate usually falls between 2% and 5%, while the average e-commerce conversion rate sits closer to 2% to 3%. The right number for your store depends on your industry, product category, price point, and traffic sources. The measure that matters most is your own conversion rate climbing over time.
Every online store eventually wants to know if its conversion rate is any good. You are driving website traffic, your product pages look clean, and orders are coming in, but without context those numbers are hard to read. Conversion rate is one of the clearest signals of how well your online store turns interest into revenue, which makes it one of the first metrics worth understanding.
The catch is that a single “good” number does not exist. A rate that looks weak in one product category can be excellent in another, and the averages you find online blend thousands of very different stores together. The useful goal is knowing your baseline, understanding what your category supports, and moving the number up.
What Is an E-Commerce Conversion Rate?
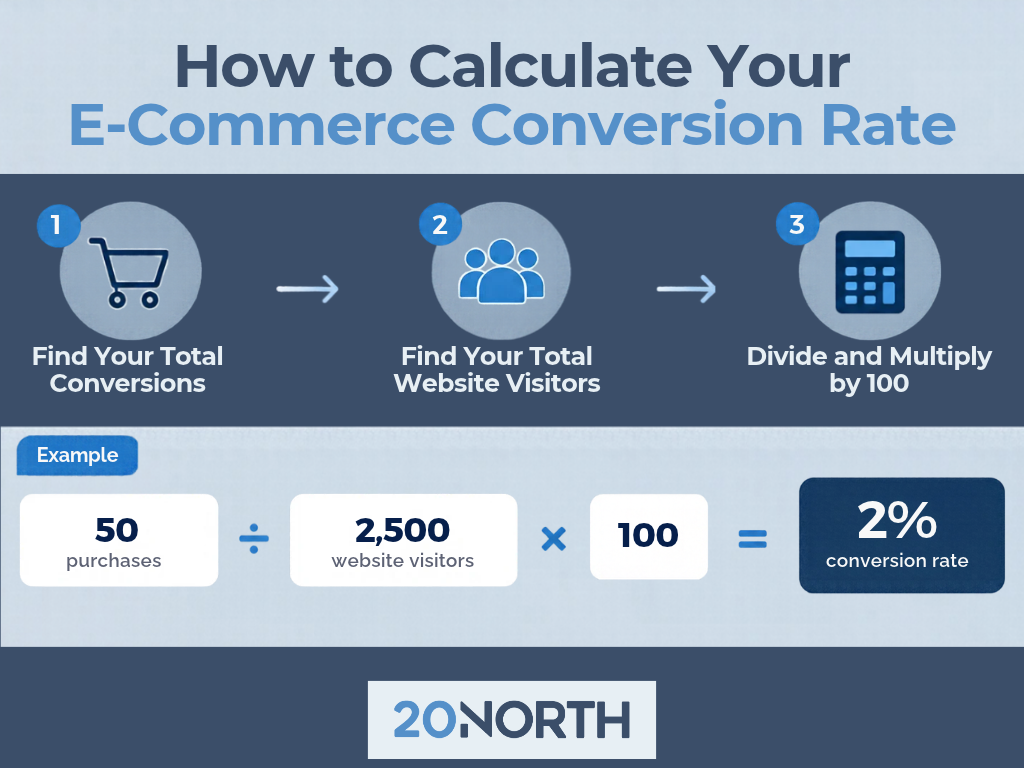
An e-commerce conversion rate is the percentage of website visitors who complete a desired action, usually a purchase. You calculate it by dividing conversions by total website traffic, then multiplying by 100. If 2,500 site visitors produce 50 orders in a month, the conversion rate is 2%.
The desired action does not have to be a sale. Plenty of stores also count newsletter signups, account creations, or add-to-cart events as conversions, depending on the goal of the page. Most tools, including Google Analytics and Shopify analytics, report the purchase version as the headline e-commerce conversion rate, which is why it has become the standard way to measure how an e-commerce website performs.
What Counts as a Good E-Commerce Conversion Rate?
Across most of the industry, a conversion rate between 2% and 5% is considered healthy, and platform-specific benchmarks tend to run lower. Littledata’s benchmark of Shopify stores puts the top 10% above 3.6% as of late 2026, though that figure moves because the benchmark runs on a rolling window. Broader market benchmark data tracks the global average closer to 2%, and that figure shifts month to month as shopping behavior changes.
These conversion rate benchmarks are a useful starting point, not a target. The global average blends supplement shops, furniture brands, and fashion retailers into one figure, so comparing your rate to the industry average for your own category tells you far more than a universal number ever could. A higher conversion rate is always the goal, but context decides what “higher” should realistically look like for your store.
Conversion Rates Vary by Industry and Product Category
Price and buying habits shape conversion rate more than almost anything else. Low-cost, repeat-purchase categories like food and personal care convert at higher rates because the decision is quick and the risk is small. Luxury goods and big-ticket items convert well below the average, since shoppers research longer and compare more before they commit.
That is why the average order value belongs right next to conversion rate when you judge performance. A store selling high-priced products at a 1% rate can earn more per visitor than a store converting at 4% on small orders. Read the two numbers together, and always measure yourself against your own product category rather than a blended global figure.
What Affects Your E-Commerce Conversion Rate
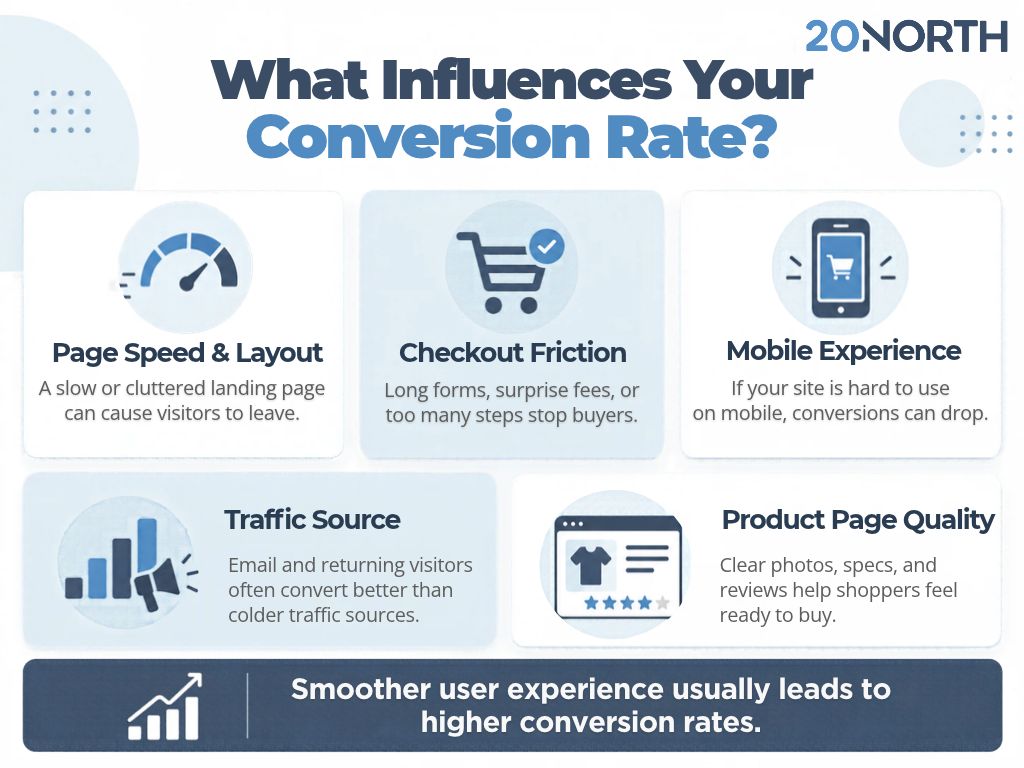
Several factors push your rate up or down, and most of them trace back to user experience. The fewer obstacles between the landing page and the checkout, the more site visitors turn into buyers.
The most common influences include:
- A slow or cluttered landing page gives potential customers a reason to leave before they ever see your products.
- Checkout friction, such as surprise shipping fees or a long form, stalls shoppers at the final step, and extra costs at checkout are one of the top reasons people abandon a purchase. The average shopping cart abandonment rate sits around 70%.
- Mobile traffic now drives most e-commerce visits, so a layout that frustrates people on mobile phones holds down your conversion rate.
- Your traffic source changes who is arriving, and visitors from email or returning customers tend to convert at a higher rate than cold traffic from social media or display ads.
- Thin product page content leaves buyers guessing, while strong photos, clear specs, and honest reviews give people the confidence to buy.
How to Improve Your E-Commerce Conversion Rate
Raising your rate is the ongoing work of conversion rate optimization, the practice of testing changes and keeping what performs.
A handful of best practices improve results for most e-commerce websites:
- Simplify the checkout process by trimming steps, enabling guest checkout, and showing shipping and tax costs early so nothing surprises the shopper at the end.
- Strengthen your product pages and landing pages with clear value, genuine reviews, and fast-loading images. Our web development team builds pages that load quickly and work cleanly on every device.
- Run an A/B test on headlines, buttons, and layouts so your decisions come from data instead of guesswork. Our conversion rate optimization checklist covers the full testing sequence.
- Bring in better-qualified website traffic through organic search and well-targeted paid campaigns, because the right visitors convert at a higher rate than broad, untargeted clicks.
- Re-engage shoppers who leave through email marketing, recovering abandoned carts and pulling return visitors back to finish the purchase.
For Shopify merchants, Shopify CRO and Shopify SEO tie these pieces together around how your store actually runs.
How to Track Your Conversion Rate
You cannot improve what you do not measure. Google Analytics and Shopify analytics both report conversion rate, and the useful insight comes from breaking it apart. Track it by traffic source, device, and product category, then watch the trend across several months instead of reacting to a single week. Traffic volume and seasonality will swing the number, so a rate that climbs steadily over time is a far better sign of healthy marketing efforts than any one strong day.
Turning Traffic Into Revenue With 20North
A good e-commerce conversion rate is less about a single target number and more about steady, measured improvement against your own baseline. Know your average, understand what your product category supports, and remove the friction between a visit and a sale.
20North helps e-commerce brands do exactly that, pairing conversion rate optimization with SEO, answer engine optimization, paid media, email marketing, and web development to turn more of your existing website traffic into revenue. Contact our team for a free CRO audit and a plan to lift your conversion rate.